Too much market noise. Not enough signal.

Stop staring at charts.Start decoding the institutional moves behind them.Pinpoint Alpha sends a plain-English read on macro signals, your watchlist, and unusual flow across the market every weekday after the close.

Plain English. Under 10 minutes.

A plain-English read on the macro, your 15 names, and unusual options flow. An evening brief plus dashboards that refresh through the session.

18+ validated models · 30+ macro data points · built around your 15 tickers

Recent Calls
HOOD·Apr 7·Institutions quietly opened a $12M bullish bet at $70+24.5% in 6 daysNVDA·Apr 2·Multi-week call accumulation keeps building at $177.50+12.9% in 9 daysLLY·Mar 17·Institutional flow turned overwhelmingly bearish−5.7% in 8 days (bearish call confirmed)LUNR·Apr 13·Breakout remains unconfirmedAvoided −6.1% lossMSFT·Apr 9·Institutions buying calls and selling puts at the same time+9.7% in 4 daysNKE·Apr 9·Massive new institutional call position opened at the $45 strike+4.3% in 4 daysHOOD·Apr 7·Institutions quietly opened a $12M bullish bet at $70+24.5% in 6 daysNVDA·Apr 2·Multi-week call accumulation keeps building at $177.50+12.9% in 9 daysLLY·Mar 17·Institutional flow turned overwhelmingly bearish−5.7% in 8 days (bearish call confirmed)LUNR·Apr 13·Breakout remains unconfirmedAvoided −6.1% lossMSFT·Apr 9·Institutions buying calls and selling puts at the same time+9.7% in 4 daysNKE·Apr 9·Massive new institutional call position opened at the $45 strike+4.3% in 4 days
Pinpoint Alpha
Mon, Mar 30 · Evening Edition
5 of 15 flagged
What happened · 3 weeks later
Outcome · 3 weeks later
Hit $691.47 · Apr 17
+29.0%
What we said · Mon, Mar 30
METABullish lean

Institutions are building bullish positioning in META even as the broad market sells off. Four call buildup signals at $550 through $600 strikes, building for five straight sessions, with positioning now 65% call-skewed. That’s accumulation against a distribution backdrop…

Support$525Resistance$560
See the full read
Open $538.42Close $535.87-0.47%

Four independent call buildup signals at $550, $560, $580, and $600 strikes, all building for five straight sessions. Institutional positioning is now 65% call-skewed even as the broader tape sells off. That's accumulation against a distribution backdrop. The $535 level has held every test this week, and divergence like this is the lead story.

What to watch

Above $535, buyers have the upper hand and recovery toward $560 is in play. Below $525, sellers could take control quickly.

01The problem

Everyone else hands you the firehose.
We hand you the read.

You already know the market is drowning in noise. Most tools just add to it: raw trades, hundreds of filters, a dozen dashboards, and you still have to figure out what matters. We do the opposite. Every options trade and block runs through 18+ statistically validated models, then you get the short list of what institutions actually did, in plain English, in minutes.

02The product

The read on institutional flow, delivered across your timeframe: a deep evening brief, dashboards that refresh four times a session, and a weekly lookback. Not an inbox you check once a day.

The Evening Brief

Every evening we read the day’s institutional flow across the market and turn it into a clean macro thesis. Then a per-ticker write-up on each of your 15 names with named bullish triggers and a single invalidation level. In your inbox by 6 PM ET, under 10 minutes to read.

Tap any surface to see how it works

Intraday Dashboard
Curated intraday checkpoints: 0DTE volume vs. baseline and the few names institutions are working, refreshed four times a session. Not a live feed.
A 0DTE Pulse that flags when same-day expiry volume is running hot or quiet against its 20-day baseline. Plus a tightly curated read on the select few names institutions are actually working at the open, midmorning, lunch, and the final hour, with hedging activity and small-print noise filtered out.
Flow Radar
The names institutions are targeting today, sorted into Momentum, Reversals, and Coiled Springs.
The handful of names institutions are actively targeting each day, sorted into Momentum, Reversals, and Coiled Springs. Strict filters, so you see what cleared the bar, not a list to triage.
Signal Lab
A per-ticker deep dive on all 15 names, refreshed every session.
A personalized deep dive on each of your 15 tickers with a written read refreshed every session. Plus a macro regime tracker spanning all six major indices, and a sentiment gauge that separates institutional flow from retail noise.
Level Map
The support and resistance institutions actually defend, drawn from real options open interest.
The support and resistance institutions actually defend, drawn from real options open interest, not eyeballed off a chart. Plus a dealer-positioning read telling you whether moves are about to get amplified or dampened, and multi-signal confirmation from flow, skew, dark pools, and OI buildup.
The Weekly Lookback
Every Sunday: last week's calls graded, plus the levels to watch next.
Every Sunday we audit last week’s calls by ticker with hits and misses on the record, surface the multi-week patterns building across the market and your 15 names, and lay out the specific levels and tickers to watch for the new week.

Built around your 15 tickers

Every brief, every dashboard, every lookback above is personalized to the watchlist you choose. Not a generic market view.

Web · Daily reference

Signal Lab Dashboard

Where the brief gives you the read, Signal Lab gives you the evidence. Click any name on your watchlist to see the flow, structure, and sentiment that built today’s call.

Signal LabRegime · flow · structure, refreshed each session
Signal Lab dashboard preview: watchlist, flow, structural levels
Email · Sunday morning

The Weekly Lookback

Pinpoint grades its own daily calls each Sunday. You see which ones played out, which didn’t, and how the patterns of the last few weeks shape the week ahead.

Weekly LookbackExcerpt from a recent recap
Pinpoint-Alpha · Weekly Recap
Week ending April 26, 2026
Weekly Market Pulse
Rotational · moderate

The week’s defining characteristic was a violent tug-of-war between mega-cap tech strength and broad market deterioration. QQQ led decisively while equal-weight RSP fell 0.3%, the widest weekly breadth gap in the current cycle. SPY’s options structure flipped between dampening and amplifying three times in five days, a level of structural instability we have not seen during this rally...

03Past calls

We don't predict the market. We deconstruct what institutions are actually doing.

We publish our calls. Then we publish what happened.

Excerpts from actual subscriber emails. Returns measured from close-of-day on call date to high/low reached within the stated window.
Brief excerptNVDA
Apr 2, 2026 · Close: $177.39Bullish

Multi-week call accumulation at $177.50 keeps building, but the $180 ceiling still needs to break.

NVDA gapped down, then clawed back to close exactly at the $177.50 call wall. That level is the pivot: signed options flow today was decisively bullish at high confidence, with institutions selling puts and buying calls in a coordinated structure that mirrors last week's conviction pattern. The multi-session call buildup at $177.50, $180, and $182.50 remains intact and building.
What happened next
+12.9% in 9 sessions
High reached
$200.35
Brief excerptHOOD
Apr 7, 2026 · Close: $69.65Bullish

HOOD held $70 and institutions quietly opened a large bullish call position for summer.

Despite four sessions of range-bound indecision, signed flow today was decisively bullish: calls bought, puts sold, with very high directional confidence. A large institution opened 14,103 June $70 calls for $12.2M, a commitment that extends well beyond this week's noise. Pin risk persists until $70 breaks cleanly in either direction.
What happened next
+24.5% in 6 sessions
High reached
$86.73
Brief excerptLLY
Mar 17, 2026 · Close: $930.35Bearish

LLY dropped 5.94% on massive volume as institutional flow turned overwhelmingly bearish.

Institutional positioning shifted decisively bearish today, with one of the most extreme directional flow readings the system produces. The $2.0B closing cluster confirms urgency. The options market structure has flipped into a regime where dealer hedging amplifies moves rather than dampening them, meaning any break below the $920 put wall could accelerate selling sharply.
Bearish call confirmed
−5.7% in 8 sessions
Low reached
$877.21
Brief excerptLUNR
Apr 13, 2026 · Close: $24.41Caution

LUNR cleared $25 intraday but closed just under the call wall: the breakout remains unconfirmed.

LUNR touched $25.55 intraday but could not hold above the call wall(a ceiling created by heavy options positioning), closing at $24.41. The closing cluster was the 15th-largest lit-exchange print in this ticker's history. Bullish call positioning is building, but until price closes above $25 with conviction, this is a range, not a breakout.
We flagged it. It failed.
Avoided −6.1% loss
Dropped to
$22.93
Brief excerptMSFT
Apr 9, 2026 · Close: $373.07Bullish

MSFT’s institutional call accumulation thesis got its strongest confirmation yet, but the stock needs to hold $370.

Yesterday's strongly bearish signed flow read was the outlier: today's session came in decisively bullish, with institutions buying calls and selling puts at the same time. That is the risk reversal structure that has defined this name for two weeks, now reconfirmed. The $370 put wall is the line that matters.
What happened next
+9.7% in 4 sessions
High reached
$409.26
Brief excerptNKE
Apr 9, 2026 · Close: $44.00Bullish

NKE’s bearish wall cracked: institutions aggressively shifted to the bull side.

A significant regime shift today. Signed flow flipped decisively bullish, the market structure flipped from amplifying to dampening moves, and a massive new institutional call position opened at the $45 strike. The $42.50 put wall that dominated this setup for weeks is still intact below, but bulls are now stacking calls above with unusual conviction.
What happened next
+4.3% in 4 sessions
High reached
$45.90

Past performance is not indicative of future results · not investment advice

The most active traders underperformed by 6.5% per year. More information led to worse returns, not better.

Barber & Odean, UC Berkeley · 66,465 investor accounts

04How we read the market

One score.
One regime.
Every trading day.

Most market reads hedge both directions every day. We chose the opposite approach. The Pinpoint Conviction Score synthesizes six major indices into a single regime score and label every trading day (bullish, bearish, or sideways), along with how mature the move is, so you know whether the trend is just forming, peaking, or stretched. Grounded in 30+ years of trend-following research, validated on a decade of live market data.

Today’s readDay 8
Strong Bull Regime
Composite of Maturity, Stretch, Slope, Stack
Range −100 to +100
Apr 8 → May 8, 2026 · 22 sessions
Bullish at SPY $676. Still bullish 22 sessions later at $738. While commentators warned of underneath divergences the whole way up, the score returned the same answer every day: bulls firmly in charge.
Built to capture sustained trends and avoid sustained drawdowns. Not built to call turns.
The four pillars
01

Maturity

How long has the trend held?

02

Stretch

How far is price from its 21-day average?

03

Slope

Is the average itself rising or falling?

04

Stack

Do multiple timeframes agree?

Pricing

Start free. Upgrade when you’re ready.

Free

$0

See the product in action. 3 briefs a week on the 4 most-watched names.

  • 3 briefs a week (Mon / Wed / Fri)
  • Full market-wide macro read
  • 4 fixed tickers: AAPL, NVDA, MSFT, TSLA
  • 1 Flow Radar signal per category per day
  • Read-only dashboard preview
  • No credit card required
Start free →
Full product

Pinpoint Alpha

$39.00
per month
  • Daily briefs (Monday–Friday)
  • Sunday Weekly Lookback
  • Full market-wide macro read
  • Up to 15 tickers (any US stock or ETF)
  • Full Flow Radar (all signals per category)
  • Signal Lab + Level Map dashboards
  • Advanced mode toggle
  • Compounding context: pattern history grows with you
Get full access →
Cancel anytime
FAQ

Short answers
to reasonable questions.

Didn't find yours? Write to admin@pinpoint-alpha.com and a human answers, usually within a few hours.

Q · 01Who is this product for?+
Pinpoint Alpha is built for anyone making deliberate, multi-day positioning decisions. The sweet spot is swing trading: positions held from a few days to a few months, which is where institutional flow and positioning patterns actually resolve.
Best fit
  • Swing traders (3 days to 3 months). The core use case. Dark pool accumulation, multi-week option buildup, and regime shifts all resolve on these timeframes.
  • Active intraday traders. Intraday dashboards refresh four times a session (open, midmorning, lunch, and the final hour) with a 0DTE pulse and the names institutions are working, for traders who want to act before the close, short of scalping tick by tick.
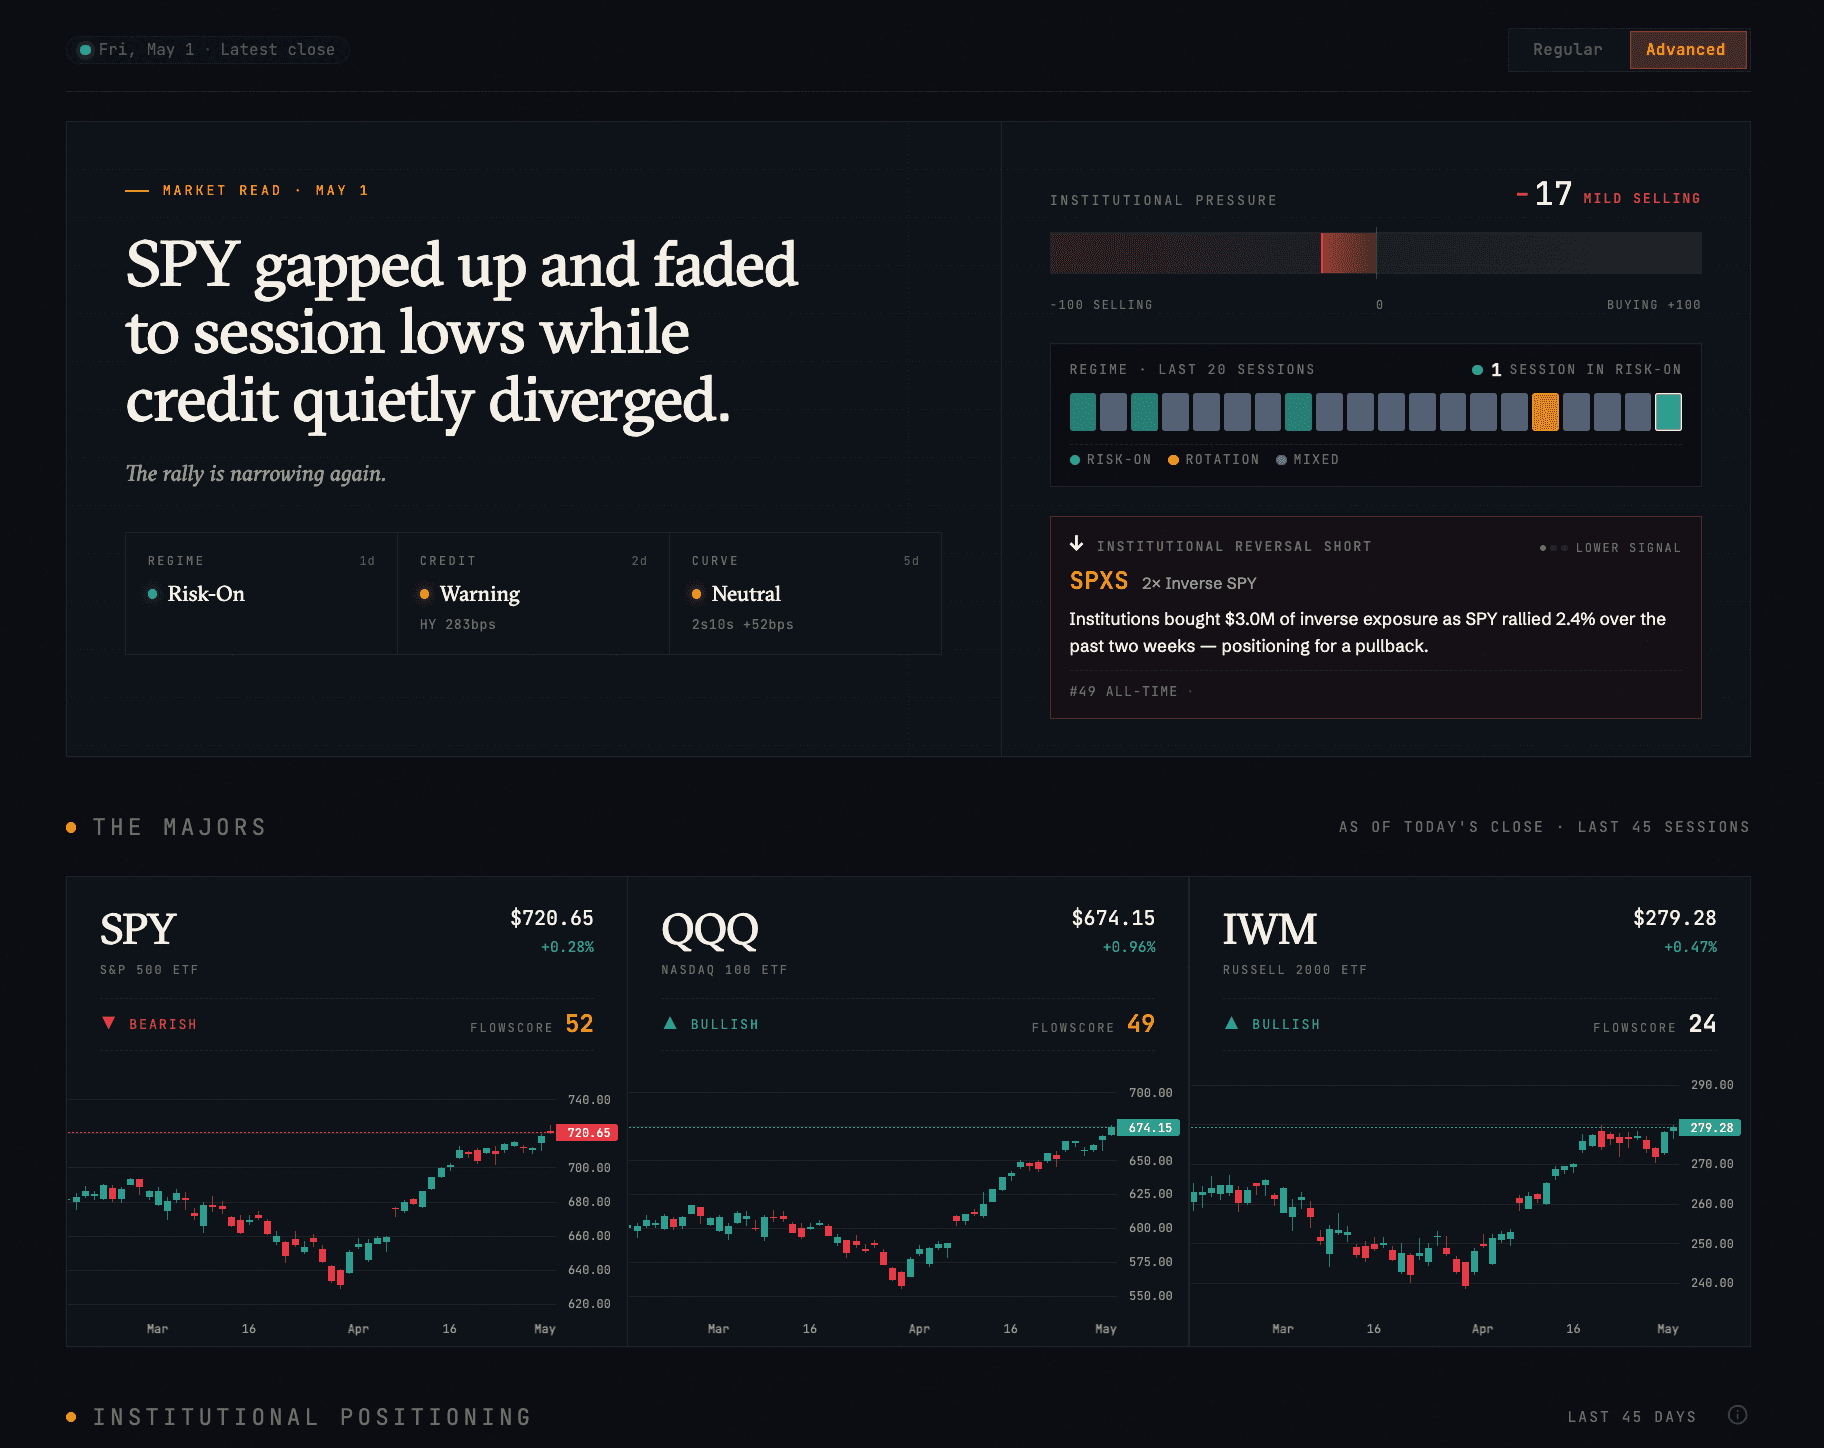
  • Long-term investors. The macro weekly recap, plus anomaly alerts on names you hold (for example, the #1 all-time block trade in AAPL hitting after a 20% rally), are useful for rebalancing decisions and staying ahead of regime shifts.
Not a fit
  • Tick-by-tick scalpers. The Intraday dashboards refresh at set points through the session (curated checkpoints, not a live streaming feed), so if you need real-time tick data, this isn't the right tool.
Both new and experienced traders are served: plain-English briefs by default, with Advanced mode exposing raw metrics and z-scores anytime.
Q · 02How is this different from an options flow scanner?+
Scanners give you thousands of data points and expect you to know which filters to set, what unusual activity actually means, and how to weigh GEX vs. skew vs. dark pool volume vs. open interest changes. That works if you have two hours and a quant background. Our pipeline processes over a dozen institutional-grade indicators, classifies retail from institutional activity, scores directional conviction, detects multi-day persistence patterns, and cross-references signals across your watchlist, all before anything reaches you. What you get is the interpretation, not the raw feed. We've already done the filtering, the weighting, and the pattern matching. You read the result.
Q · 03Why only 15 tickers?+
Every subscriber already gets a full macro analysis covering over 30 data points: major indices, VIX, credit, leveraged ETFs, and key economic indicators. That broad market read comes standard. The 15-ticker limit applies to the individual deep dives, and it's intentional. A study of 66,465 household brokerage accounts found that investors who concentrated in fewer stocks outperformed diversified accounts, especially when focused on names they knew well. Economists at NYU and Columbia formalized why: the more you know about an asset, the more valuable each additional day of data becomes. Focus creates knowledge, knowledge creates edge, edge rewards focus. Our system builds weeks of pattern history on each of your names, and that context gets richer over time. Spreading thin would dilute the very thing that makes the analysis valuable. Our Method page covers the full research behind this.
Q · 04Can I change my 15 tickers?+
Yes. You get one instant swap per week from the Signal Lab dashboard. If you want to change more, queue them up and they rotate in on Sunday, ready for Monday's session. The system needs a day or two to build pattern history on new names, so this pacing keeps your analysis quality high rather than treating the platform like a scanner.
Q · 05I already understand GEX, skew, and flow. Is this still useful?+
Yes, and possibly more so. We offer an Advanced mode that includes raw metric details, z-scores, and more technical dashboards. You can switch between standard and advanced anytime. But even beyond the data presentation, the real value is coverage: tracking these signals simultaneously across 15 names, every session, while maintaining multi-week context on each is hard to do with a day job. Our pipeline does it systematically: scoring directional flow, modeling volatility surfaces, tracking dark pool persistence, and mapping structural levels from options positioning. Think of it as a research analyst who watches your names full-time and briefs you each evening.
Q · 06When do the emails arrive?+
Each evening after market close on every U.S. trading day. We wait for the full session to close so the analysis reflects the complete picture, and aim to land in your inbox before dinner.
Q · 07What happens during earnings or unusual events?+
The brief adapts. Earnings windows, Fed days, and unusual volatility events get explicit framing: what positioning looked like going in, how it shifted, and what the post-event resolution suggests. Big days get more coverage, not less.
Q · 08Is this investment advice?+
No. Pinpoint Alpha is market analysis and a research product. We describe what institutional positioning is doing; we do not tell you what to trade, when to trade, or how much. All decisions remain yours, and nothing in the brief constitutes a recommendation under applicable securities regulation.

The read institutions get.
Now in your inbox.

Pinpoint Alpha